Card1
Tree Mapping
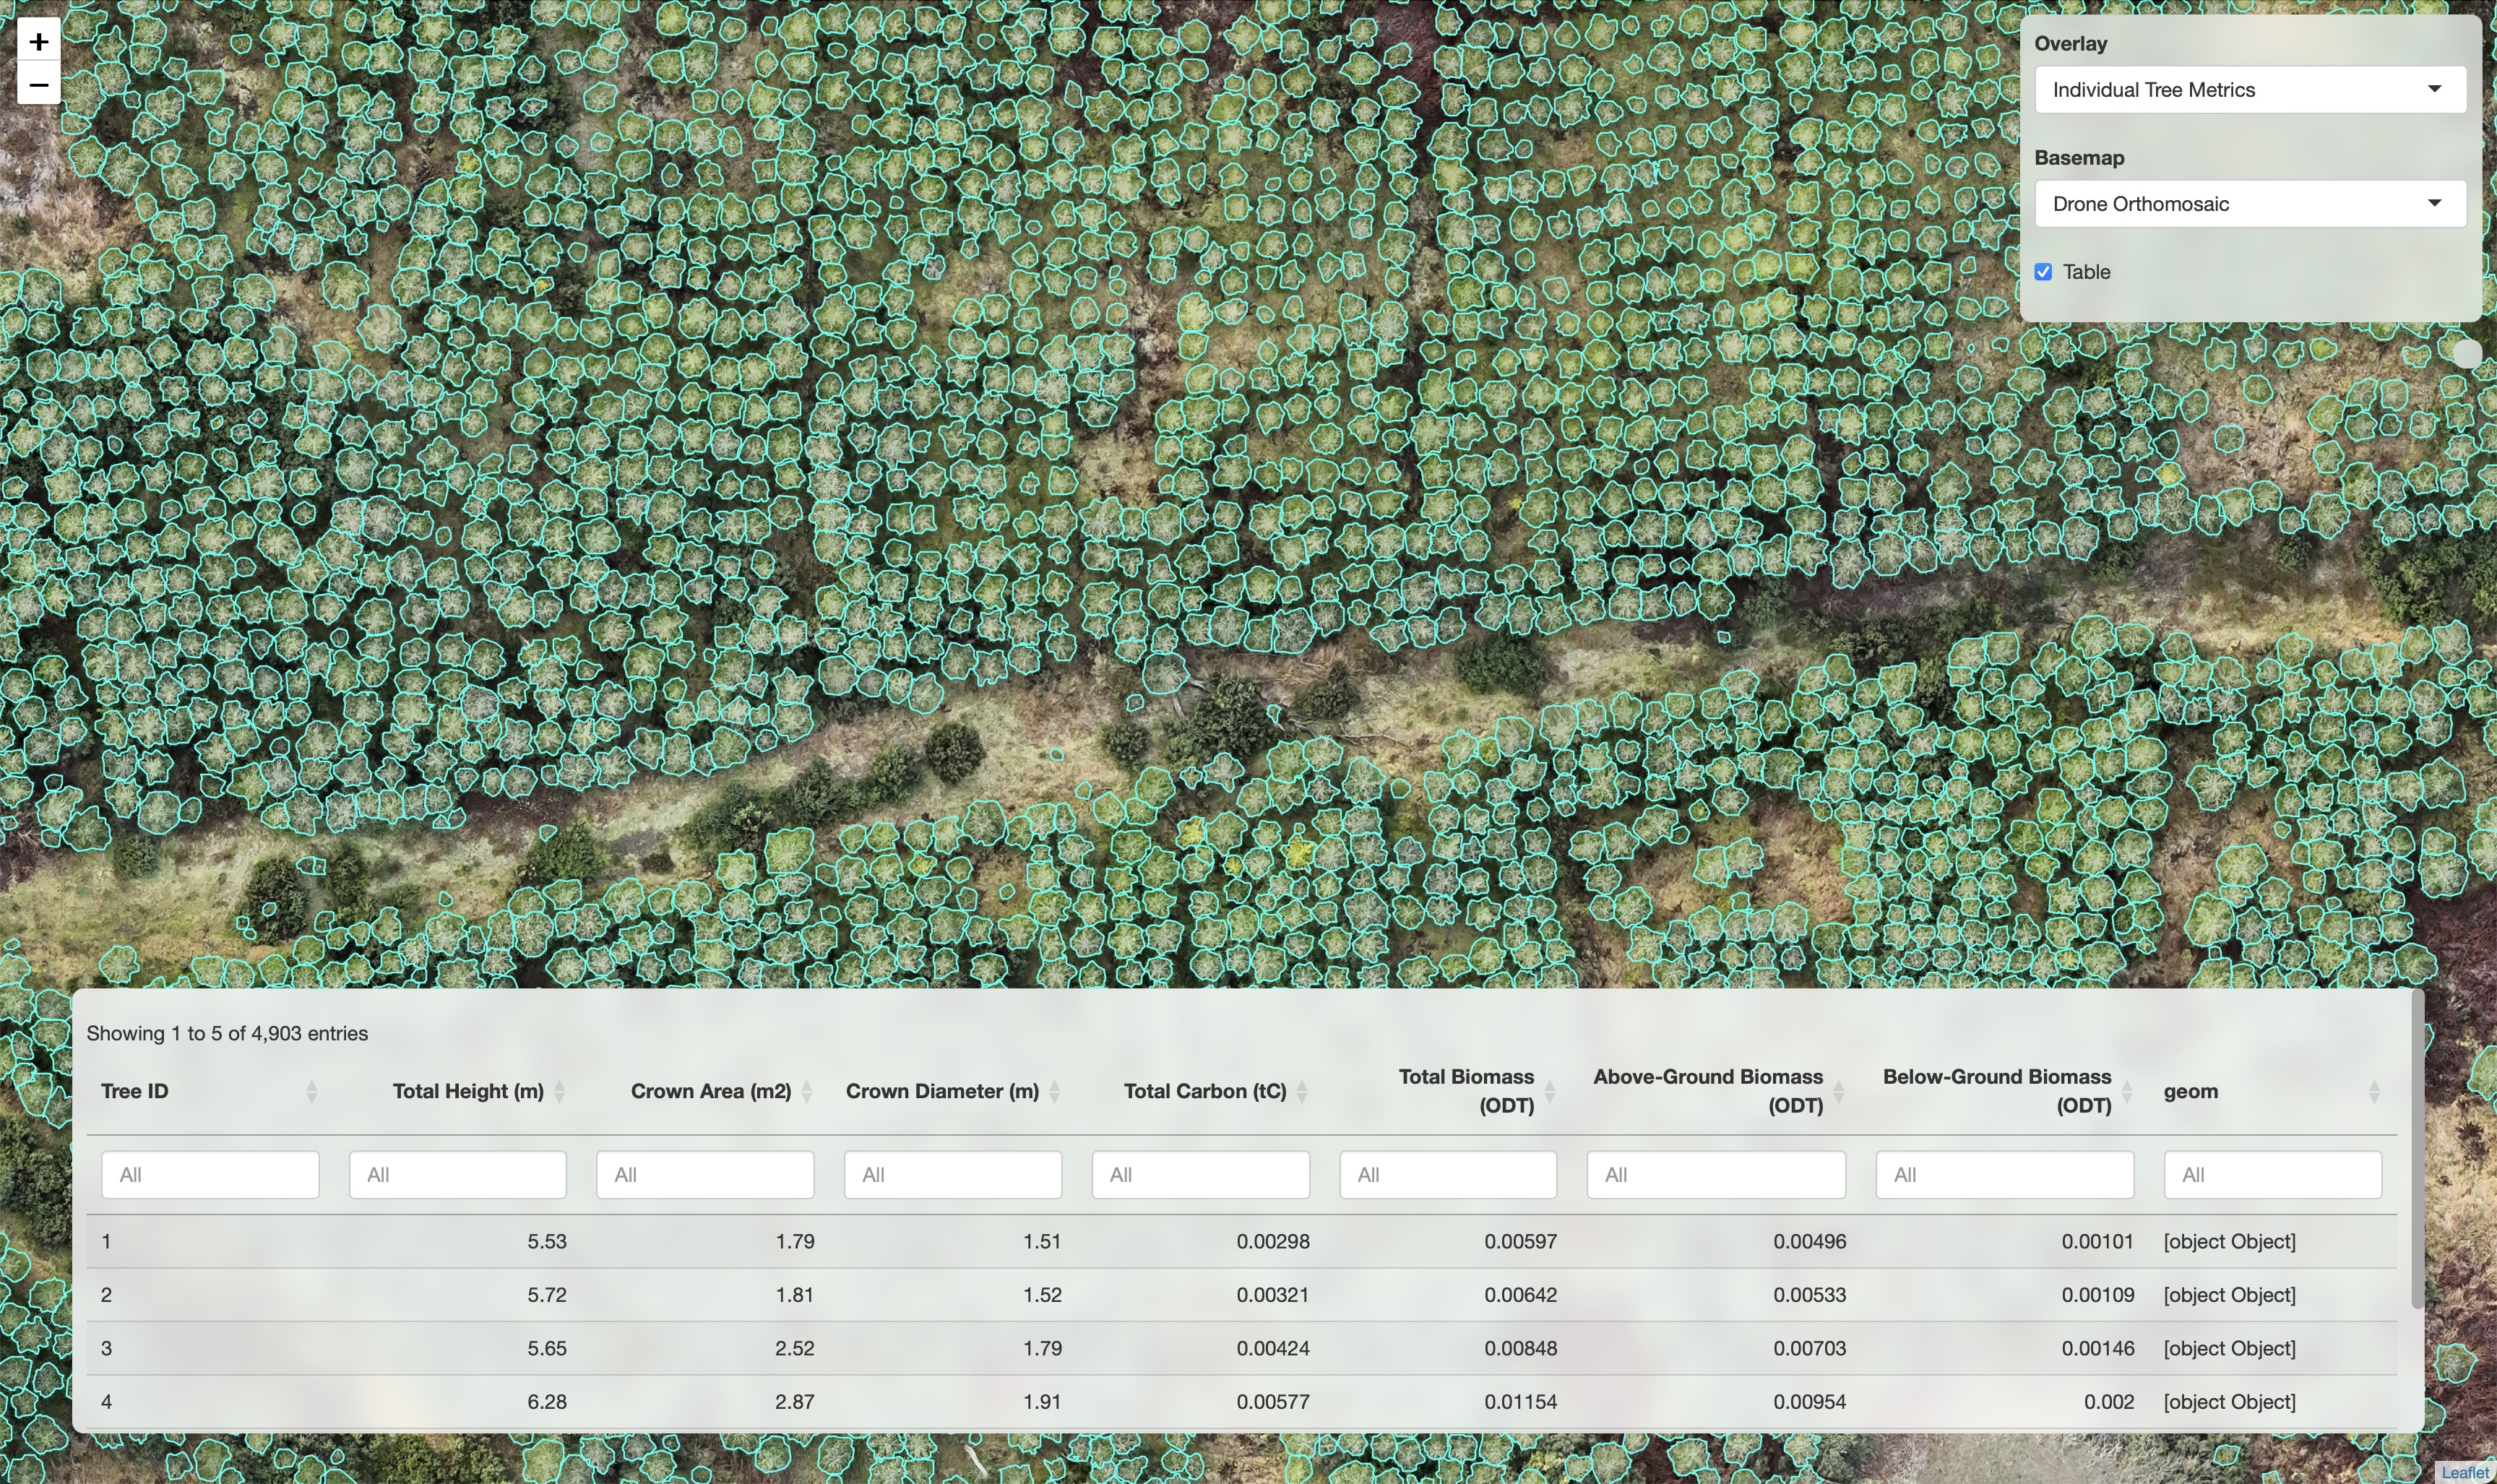
This approach uses drones, deep learning and a custom spatial analysis to map woodland at the individual tree level, with valuable metrics reported for each. I have created a custom web map to visualise the results, reach out for access to a demo.
Imagecard1
Image
Caption
Interactive web map to visualise analysis outputs.
Image
Caption
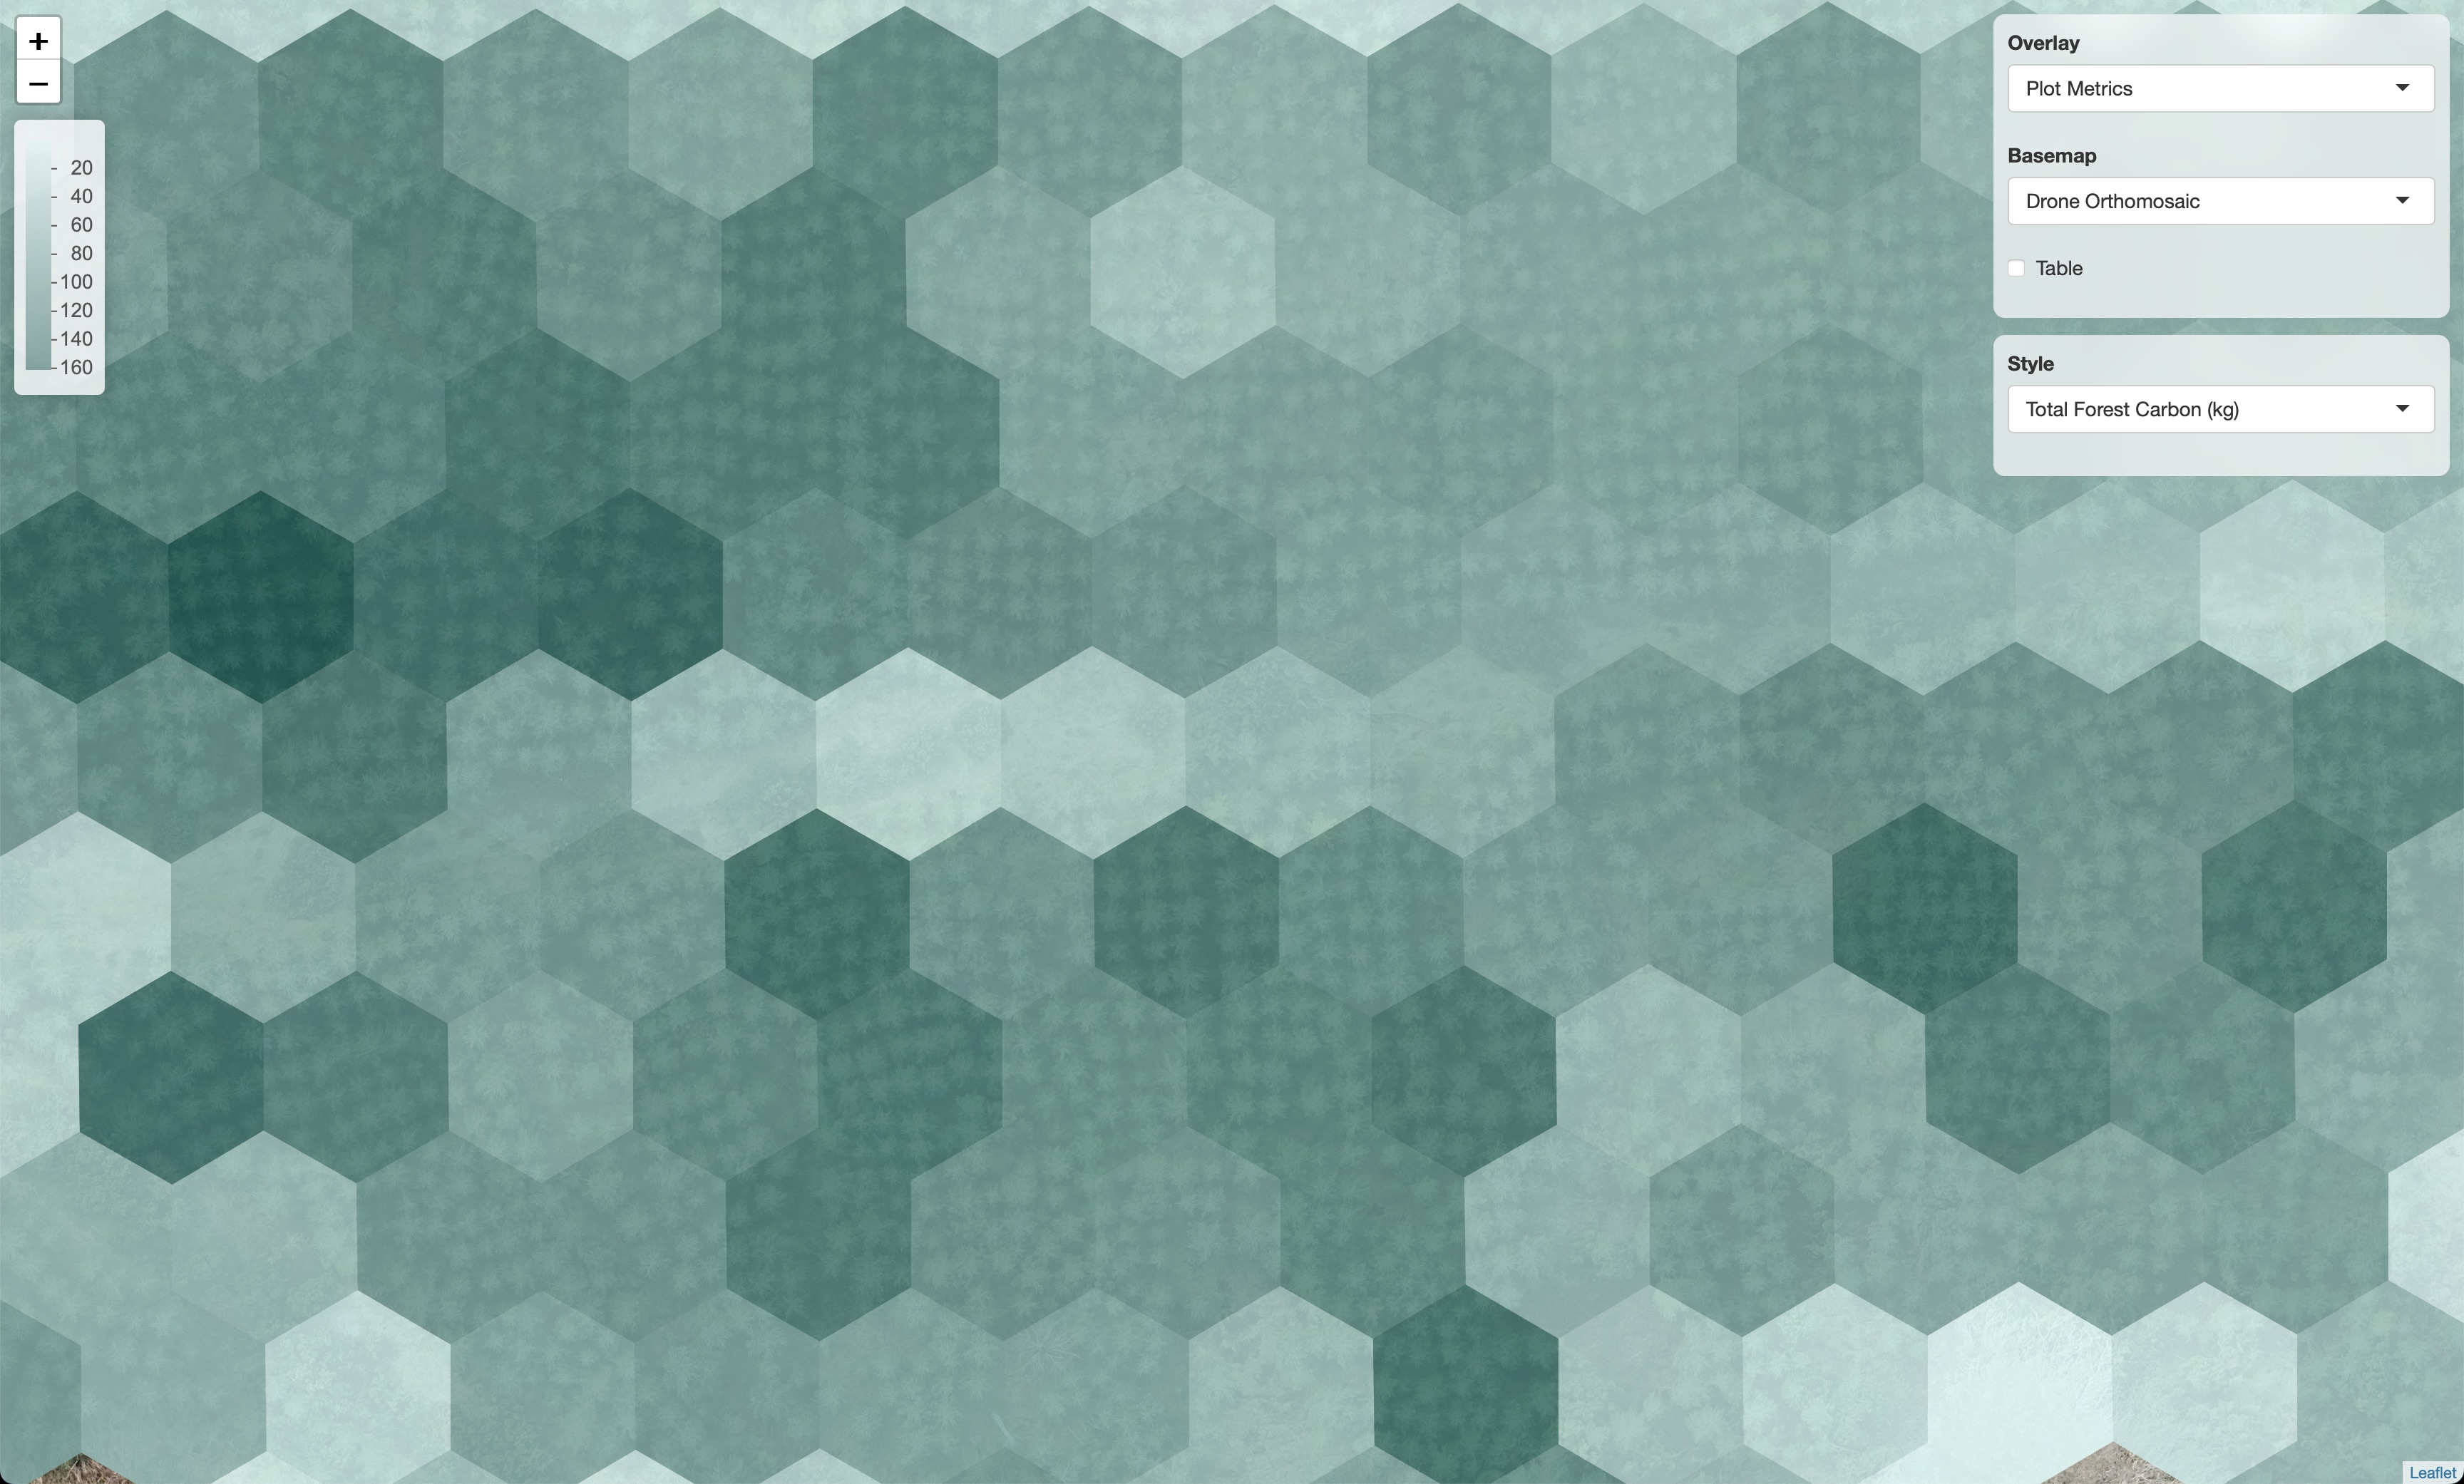
Different metrics such as stem density and carbon estimates are presented in a hexagonal grid.
Card1
Tree Classification
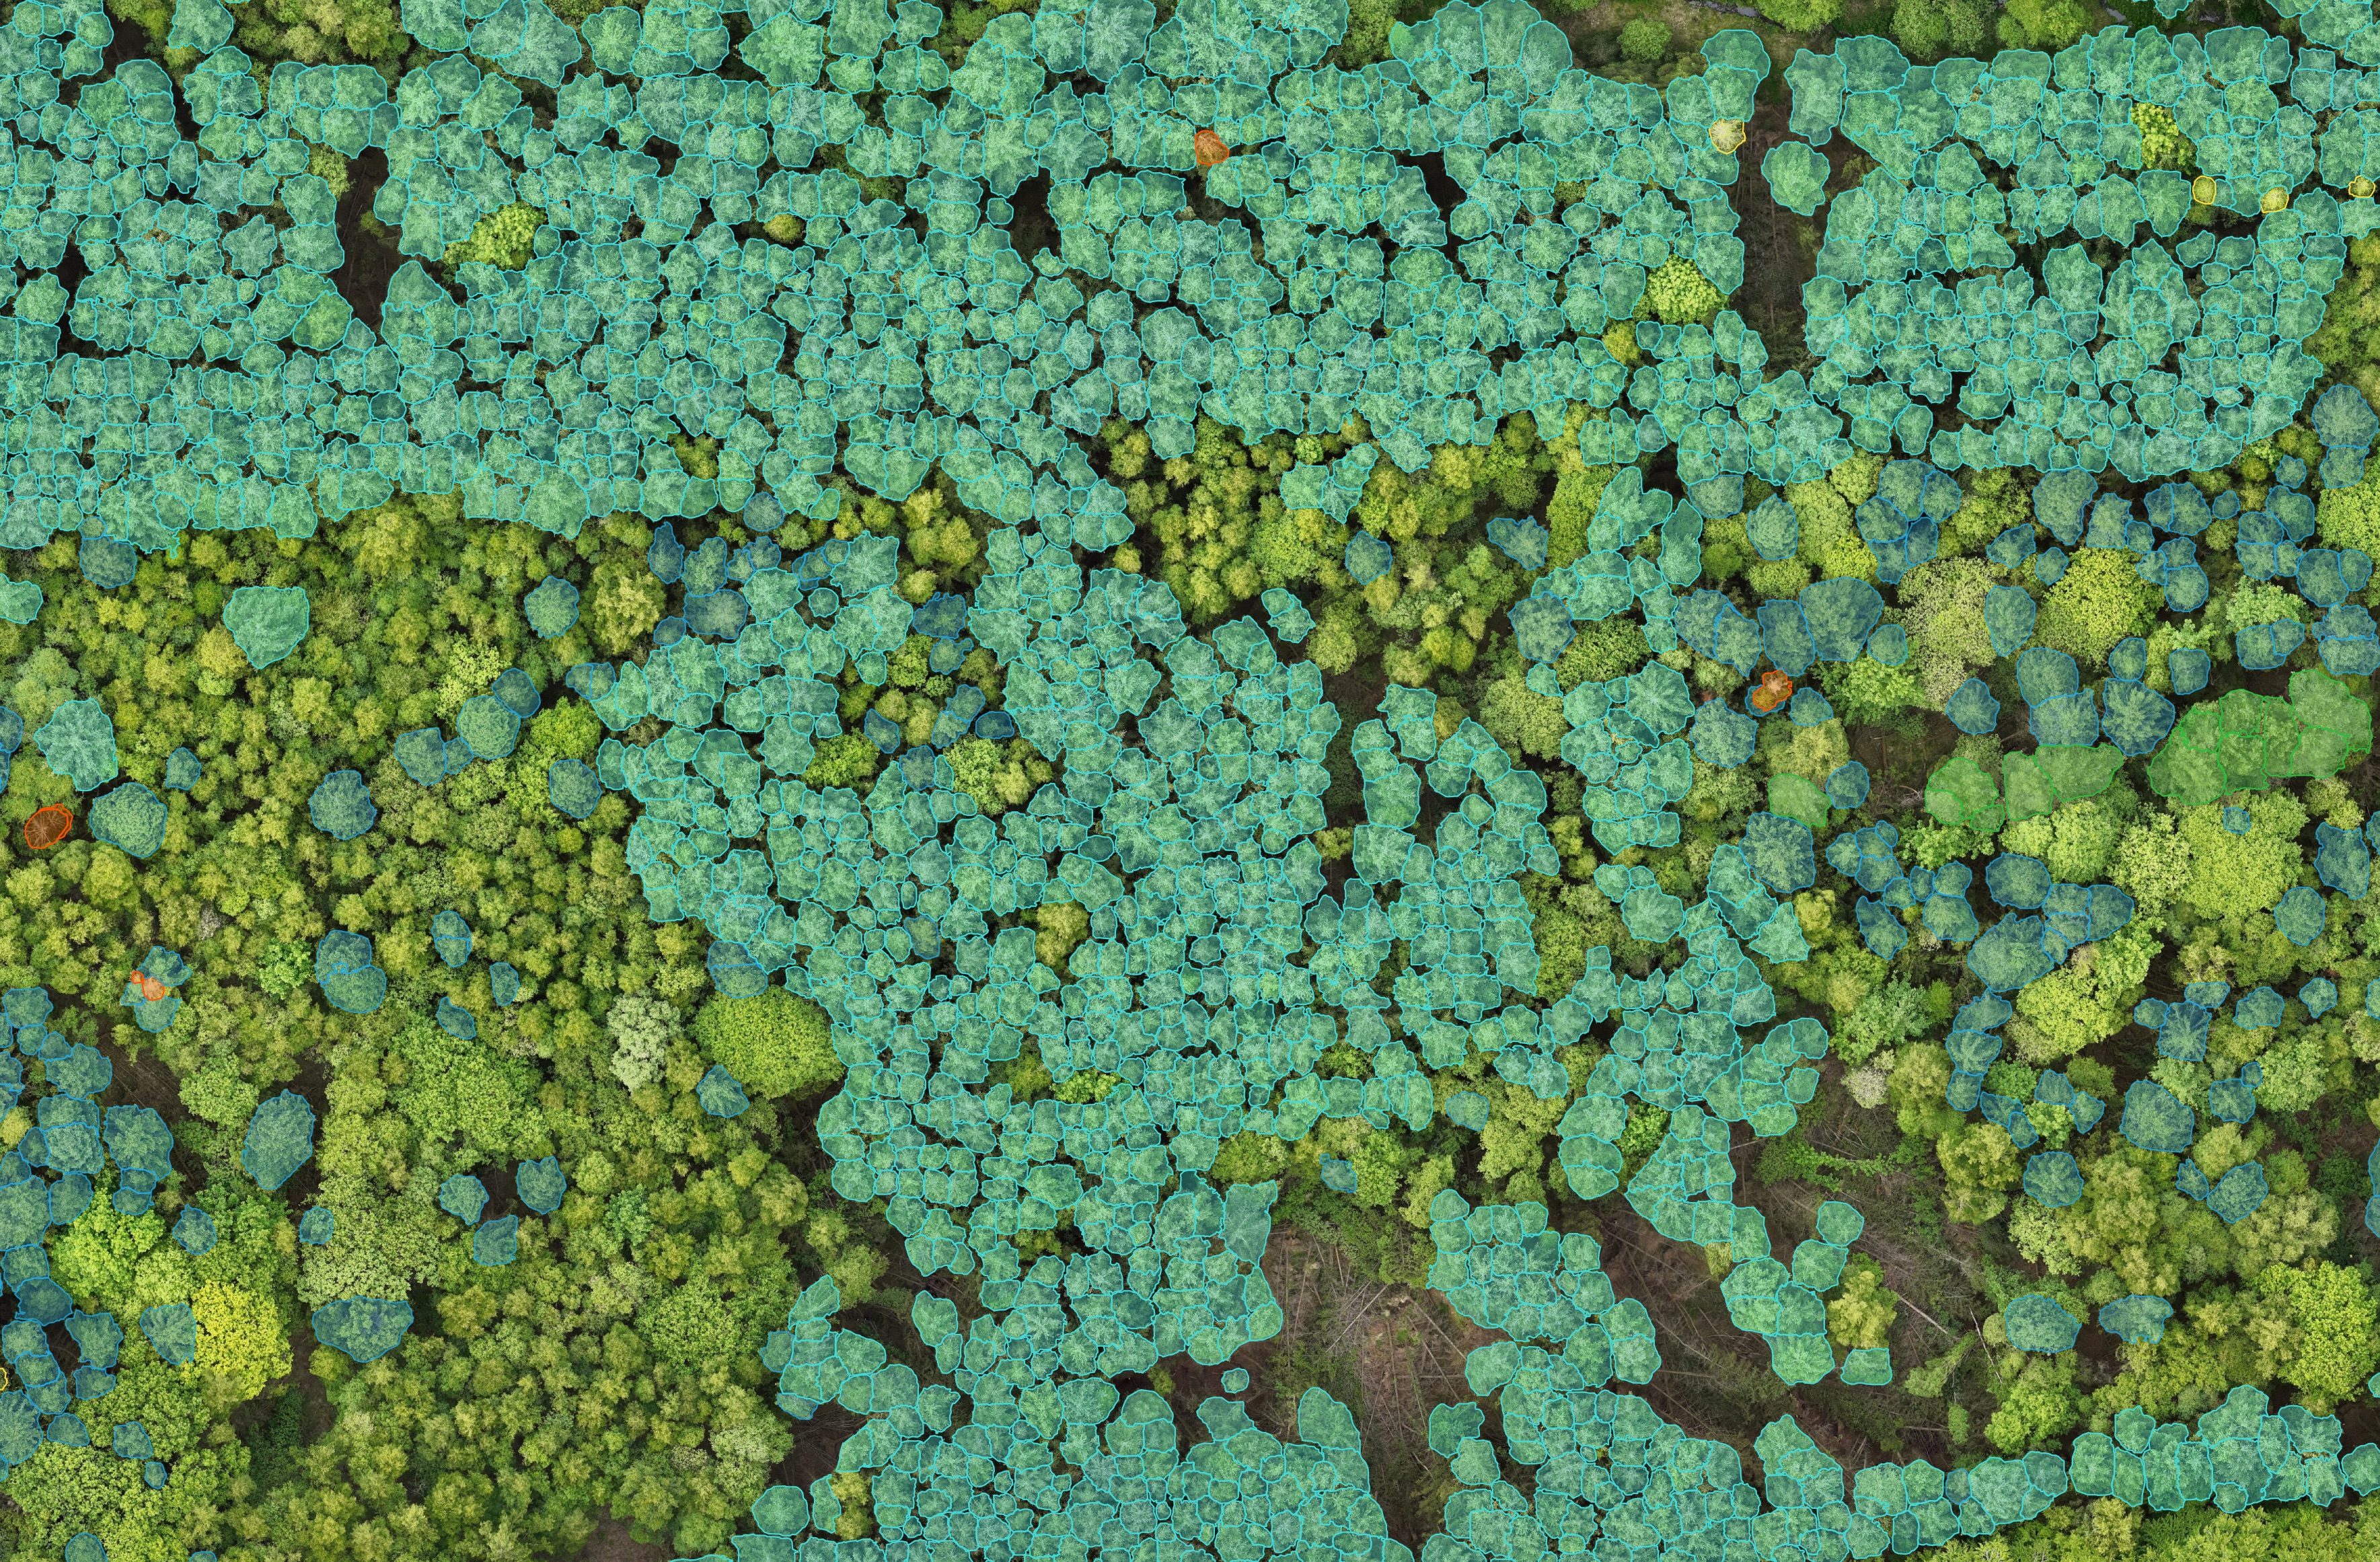
I also train models to classify tree species using drone imagery. The example below shows predictions from a deep learning model targeting four species across a 90-hectare mixed forest. The model distinguishes conifers from broadleaves, some of which look similar from above. Other techniques are more appropriate for the broadleaves here due to overlapping crowns. I plan to incorporate other remote sensing technologies to improve coverage.
Imagecard1
Image
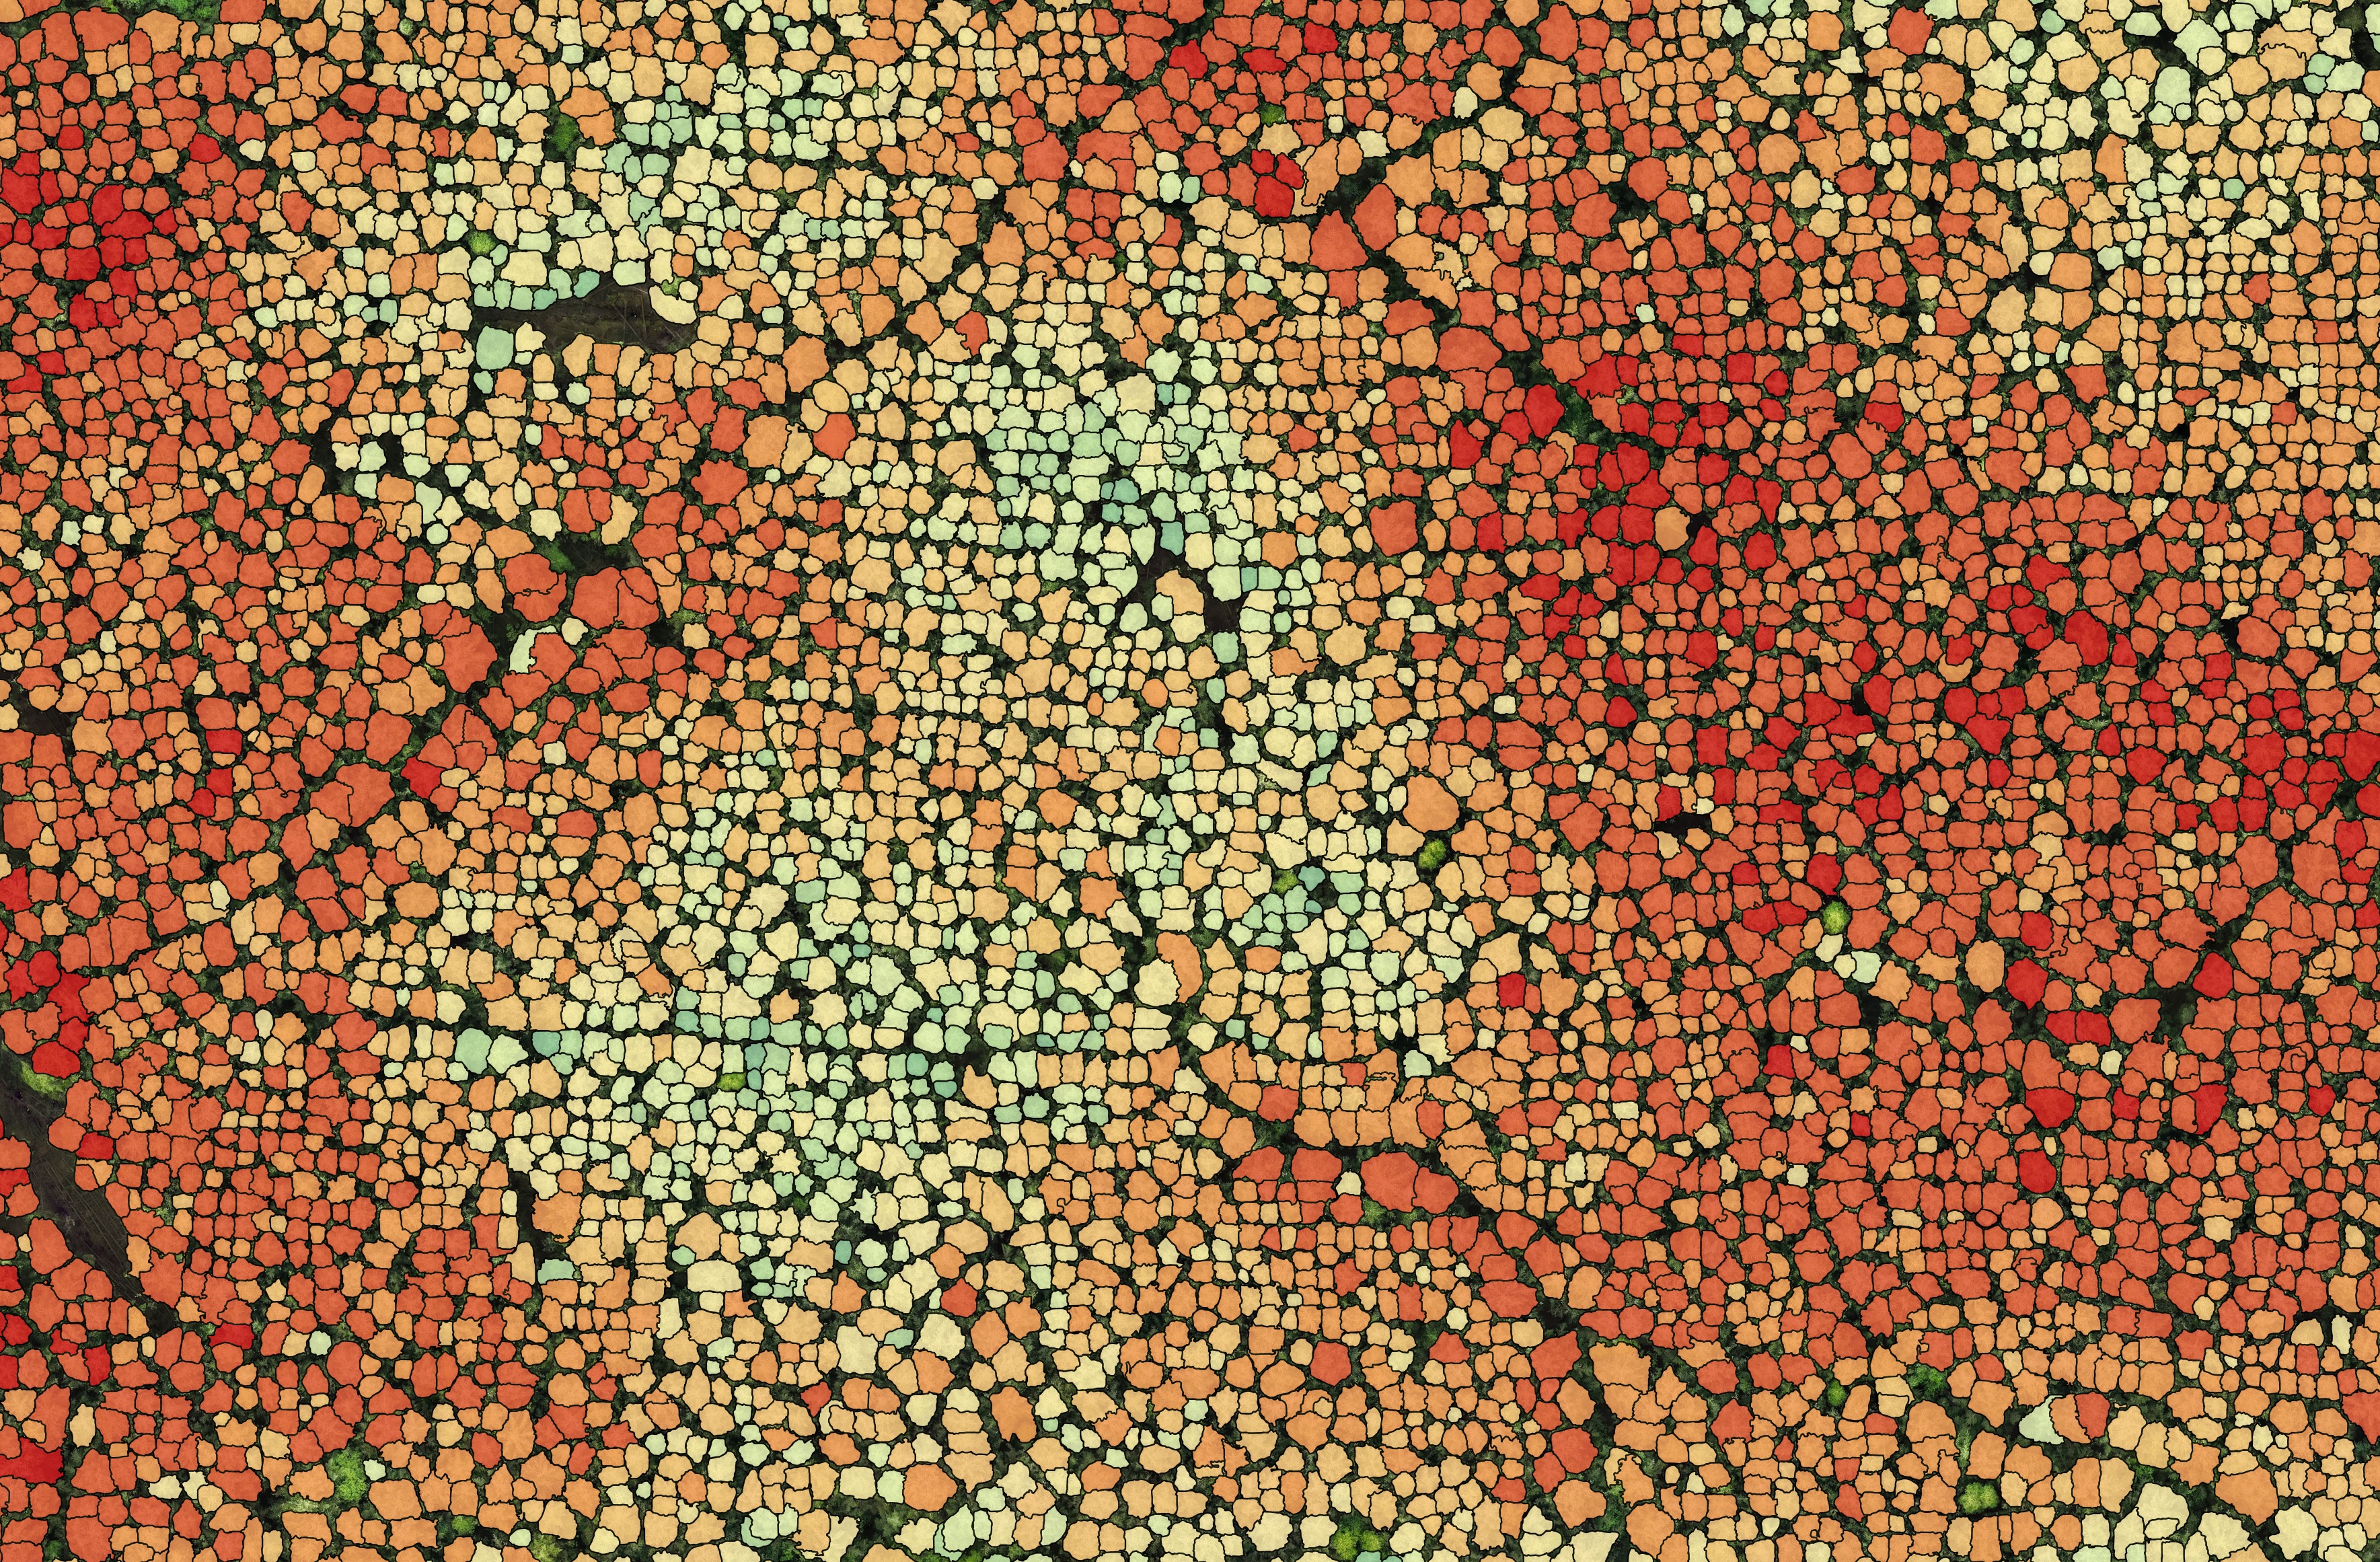
Caption
Segmented conifer tree crowns coloured by species classification.
Image
Caption
Segmented conifer tree crowns coloured by height.
Card1
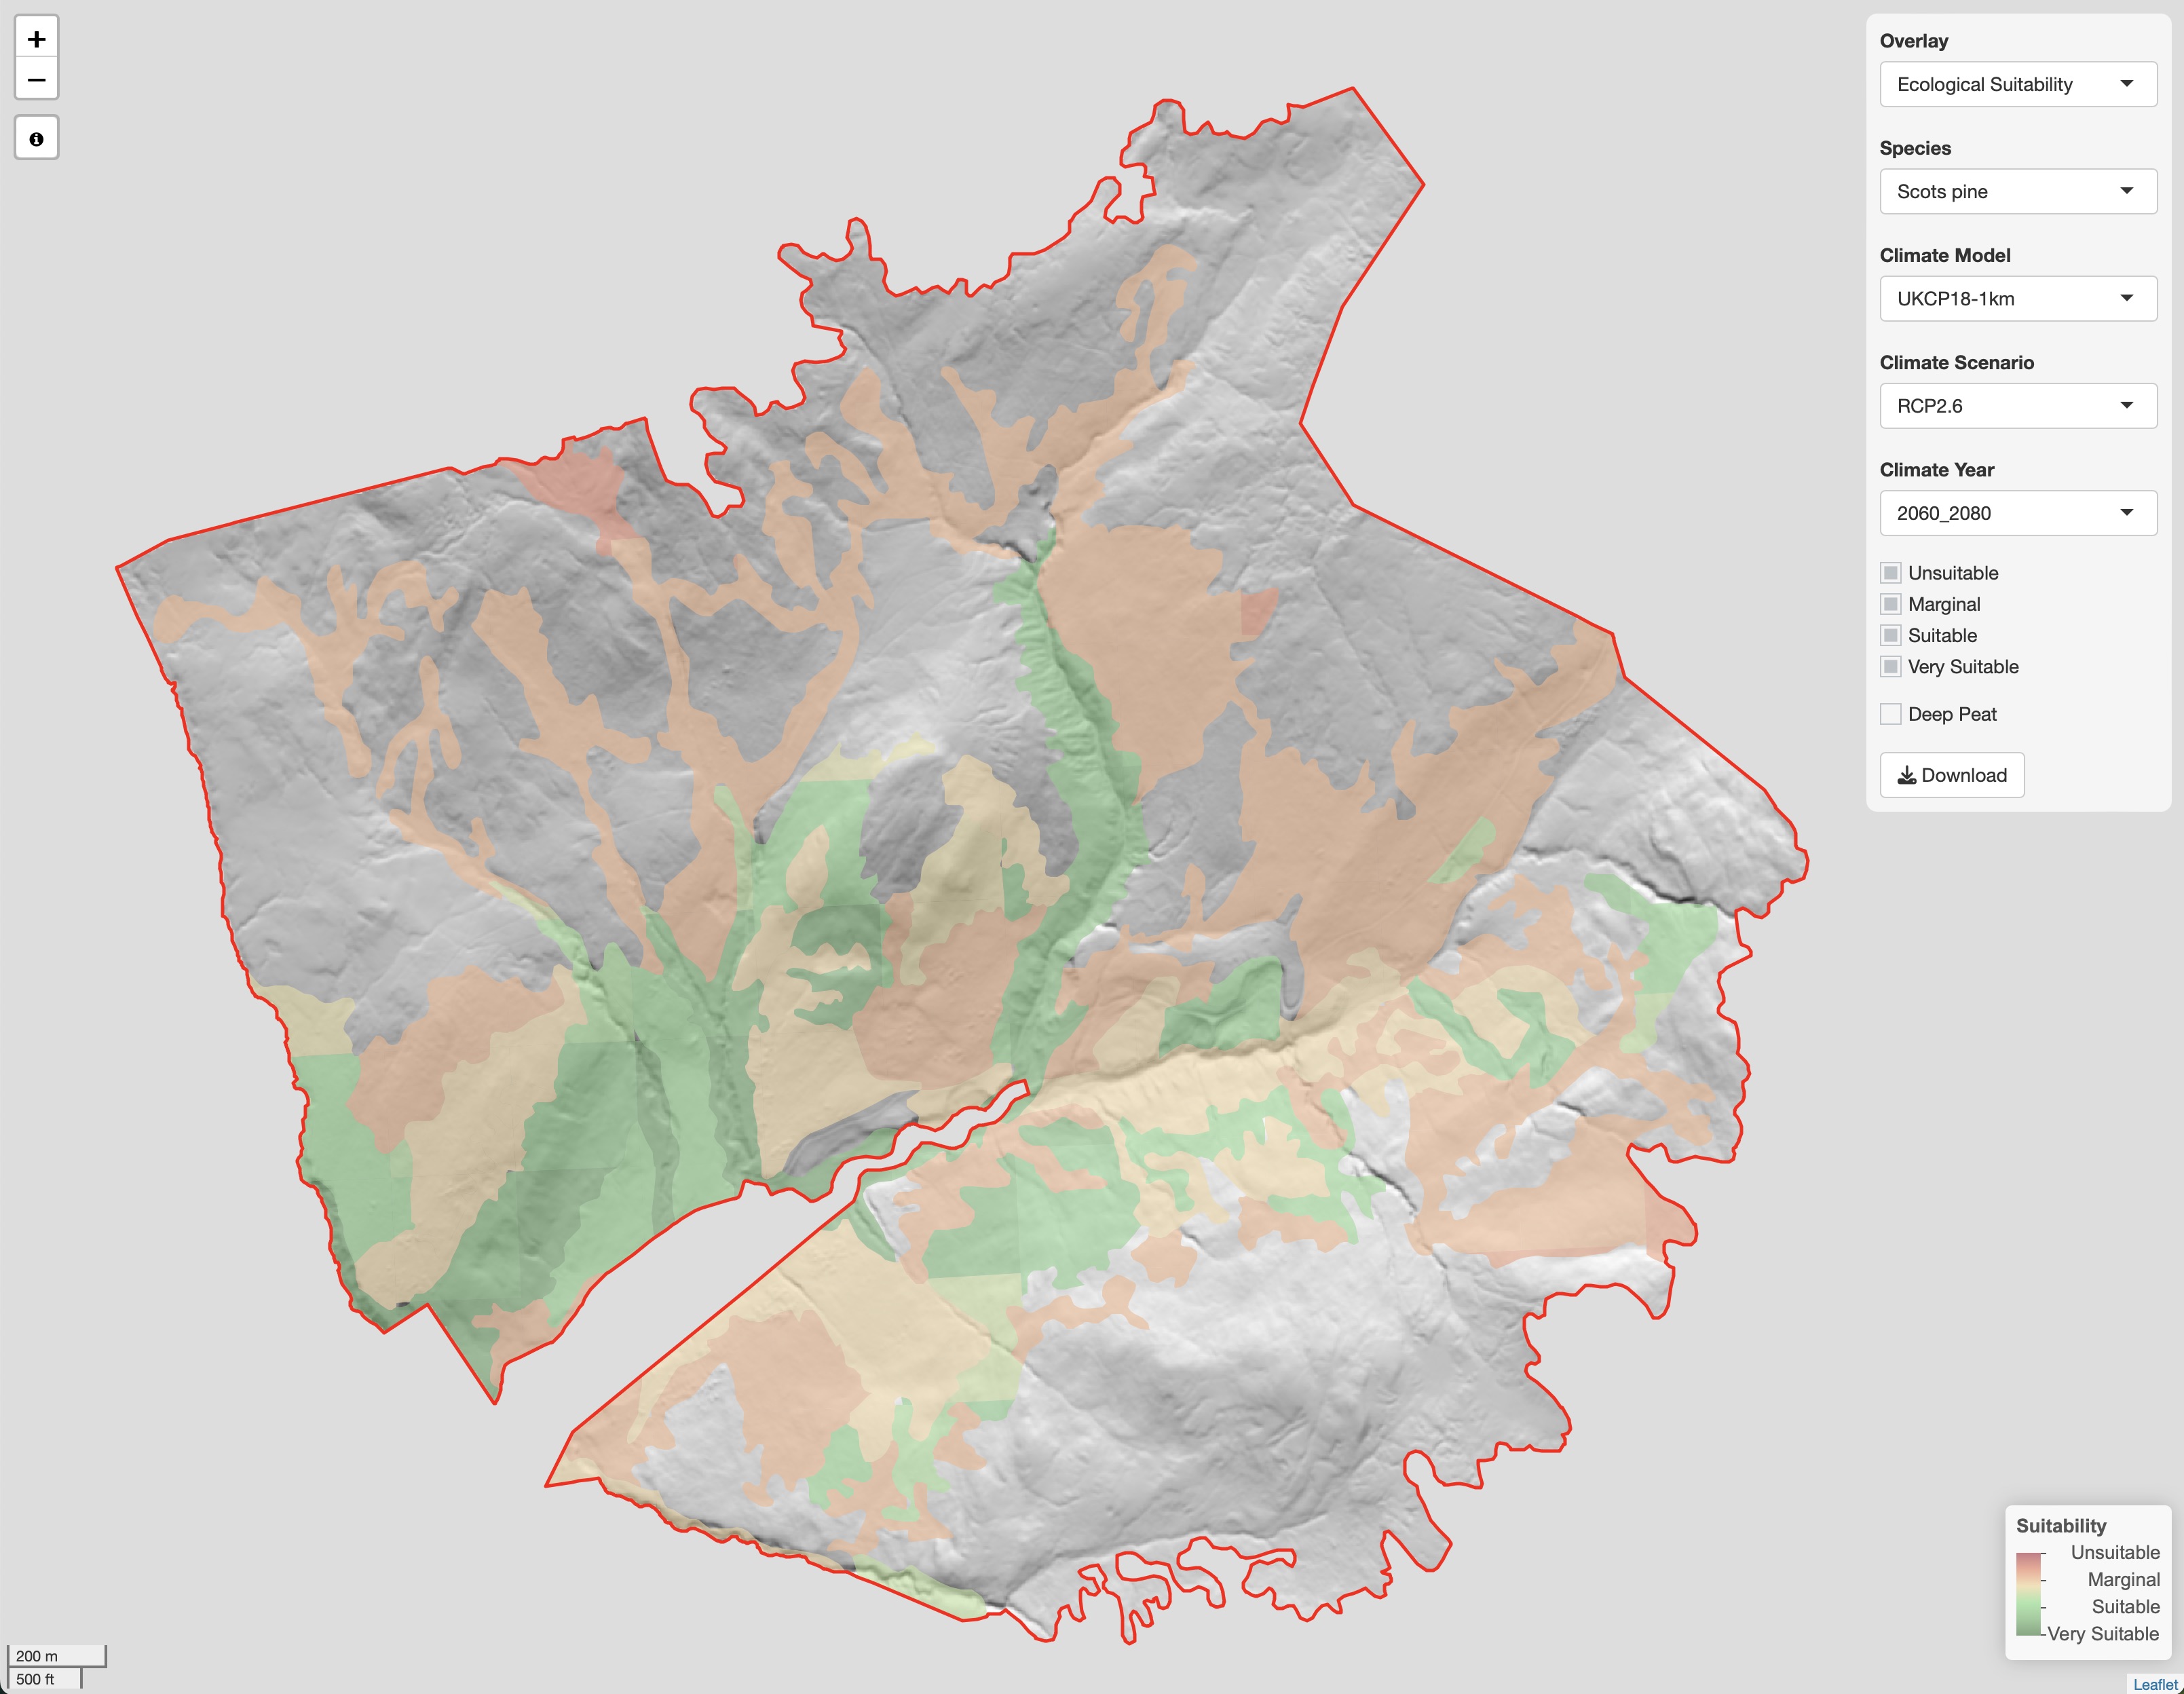
Woodland Suitability
I have created an interactive map tool for comprehensive Ecological Site Classification (ESC) woodland suitability assessments. Detailed maps are created from your site-specific soil and/or habitat surveys, offering a spatially rich alternative to point observations. A custom web map provides an intuitive platform to assess suitability variation across a site under different future climate scenarios, helping match species to site conditions. Reach out for access to a demo.
Imagecard1
Image
Caption
Interactive web map to visualise and download ESC prediction maps for various tree species.